#load in data <- tidytuesdayR:: tt_load ('2023-04-11' )
    Downloading file 1 of 2: `egg-production.csv`
    Downloading file 2 of 2: `cage-free-percentages.csv`
List of 2
 $ egg-production       : spc_tbl_ [220 × 6] (S3: spec_tbl_df/tbl_df/tbl/data.frame)
  ..$ observed_month: Date[1:220], format: "2016-07-31" "2016-08-31" ...
  ..$ prod_type     : chr [1:220] "hatching eggs" "hatching eggs" "hatching eggs" "hatching eggs" ...
  ..$ prod_process  : chr [1:220] "all" "all" "all" "all" ...
  ..$ n_hens        : num [1:220] 57975000 57595000 57161000 56857000 57116000 ...
  ..$ n_eggs        : num [1:220] 1.15e+09 1.14e+09 1.09e+09 1.13e+09 1.10e+09 ...
  ..$ source        : chr [1:220] "ChicEggs-09-23-2016.pdf" "ChicEggs-10-21-2016.pdf" "ChicEggs-11-22-2016.pdf" "ChicEggs-12-23-2016.pdf" ...
  ..- attr(*, "spec")=
  .. .. cols(
  .. ..   observed_month = col_date(format = ""),
  .. ..   prod_type = col_character(),
  .. ..   prod_process = col_character(),
  .. ..   n_hens = col_double(),
  .. ..   n_eggs = col_double(),
  .. ..   source = col_character()
  .. .. )
  ..- attr(*, "problems")=<externalptr>
 $ cage-free-percentages: spc_tbl_ [96 × 4] (S3: spec_tbl_df/tbl_df/tbl/data.frame)
  ..$ observed_month: Date[1:96], format: "2007-12-31" "2008-12-31" ...
  ..$ percent_hens  : num [1:96] 3.2 3.5 3.6 4.4 5.4 6 5.9 5.7 8.6 9.9 ...
  ..$ percent_eggs  : num [1:96] NA NA NA NA NA NA NA NA NA NA ...
  ..$ source        : chr [1:96] "Egg-Markets-Overview-2019-10-19.pdf" "Egg-Markets-Overview-2019-10-19.pdf" "Egg-Markets-Overview-2019-10-19.pdf" "Egg-Markets-Overview-2019-10-19.pdf" ...
  ..- attr(*, "spec")=
  .. .. cols(
  .. ..   observed_month = col_date(format = ""),
  .. ..   percent_hens = col_double(),
  .. ..   percent_eggs = col_double(),
  .. ..   source = col_character()
  .. .. )
  ..- attr(*, "problems")=<externalptr>
 - attr(*, ".tt")= 'tt' chr [1:2] "egg-production.csv" "cage-free-percentages.csv"
  ..- attr(*, ".files")='data.frame':   2 obs. of  3 variables:
  .. ..$ data_files: chr [1:2] "egg-production.csv" "cage-free-percentages.csv"
  .. ..$ data_type : chr [1:2] "csv" "csv"
  .. ..$ delim     : chr [1:2] "," ","
  ..- attr(*, ".readme")=List of 2
  .. ..$ node:<externalptr>
  .. ..$ doc :<externalptr>
  .. ..- attr(*, "class")= chr [1:2] "xml_document" "xml_node"
  ..- attr(*, ".date")= Date[1:1], format: "2023-04-11"
 - attr(*, "class")= chr "tt_data"
#closer look at variables <- raw_data$ ` egg-production ` glimpse (eggproduction)
Rows: 220
Columns: 6
$ observed_month <date> 2016-07-31, 2016-08-31, 2016-09-30, 2016-10-31, 2016-1…
$ prod_type      <chr> "hatching eggs", "hatching eggs", "hatching eggs", "hat…
$ prod_process   <chr> "all", "all", "all", "all", "all", "all", "all", "all",…
$ n_hens         <dbl> 57975000, 57595000, 57161000, 56857000, 57116000, 57750…
$ n_eggs         <dbl> 1147000000, 1142700000, 1093300000, 1126700000, 1096600…
$ source         <chr> "ChicEggs-09-23-2016.pdf", "ChicEggs-10-21-2016.pdf", "…
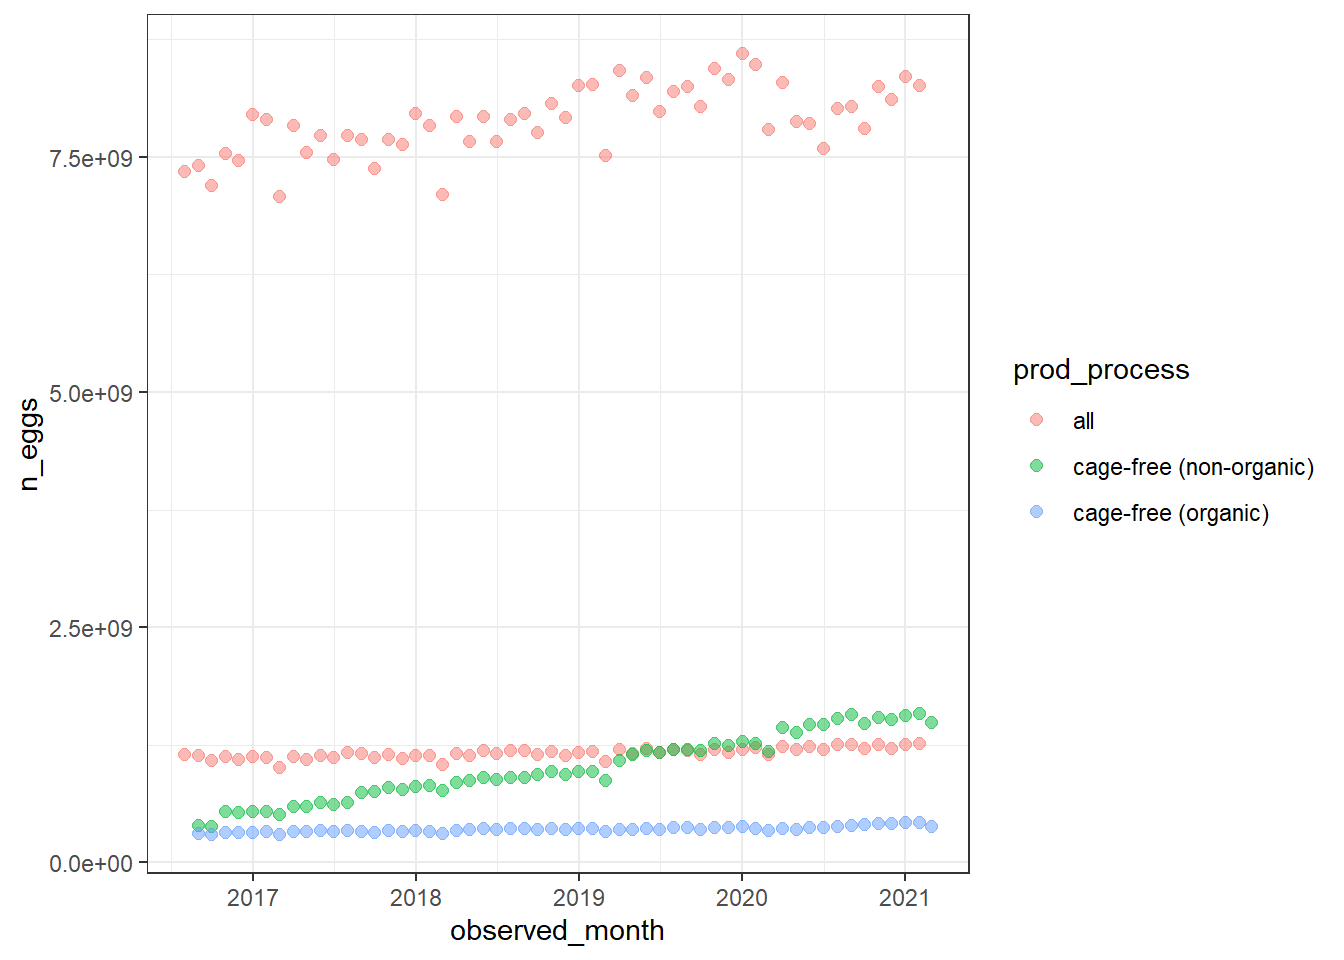
unique (eggproduction$ prod_type)
[1] "hatching eggs" "table eggs"
unique (eggproduction$ prod_process)
[1] "all"                     "cage-free (non-organic)"
[3] "cage-free (organic)"
 observed_month        prod_type         prod_process           n_hens
 Min.   :2016-07-31   Length:220         Length:220         Min.   : 13500000
 1st Qu.:2017-09-30   Class :character   Class :character   1st Qu.: 17284500
 Median :2018-11-15   Mode  :character   Mode  :character   Median : 59939500
 Mean   :2018-11-14                                         Mean   :110839873
 3rd Qu.:2019-12-31                                         3rd Qu.:125539250
 Max.   :2021-02-28                                         Max.   :341166000
     n_eggs             source
 Min.   :2.981e+08   Length:220
 1st Qu.:4.240e+08   Class :character
 Median :1.155e+09   Mode  :character
 Mean   :2.607e+09
 3rd Qu.:2.963e+09
 Max.   :8.601e+09
<- raw_data$ ` cage-free-percentages ` glimpse (cagefree)
Rows: 96
Columns: 4
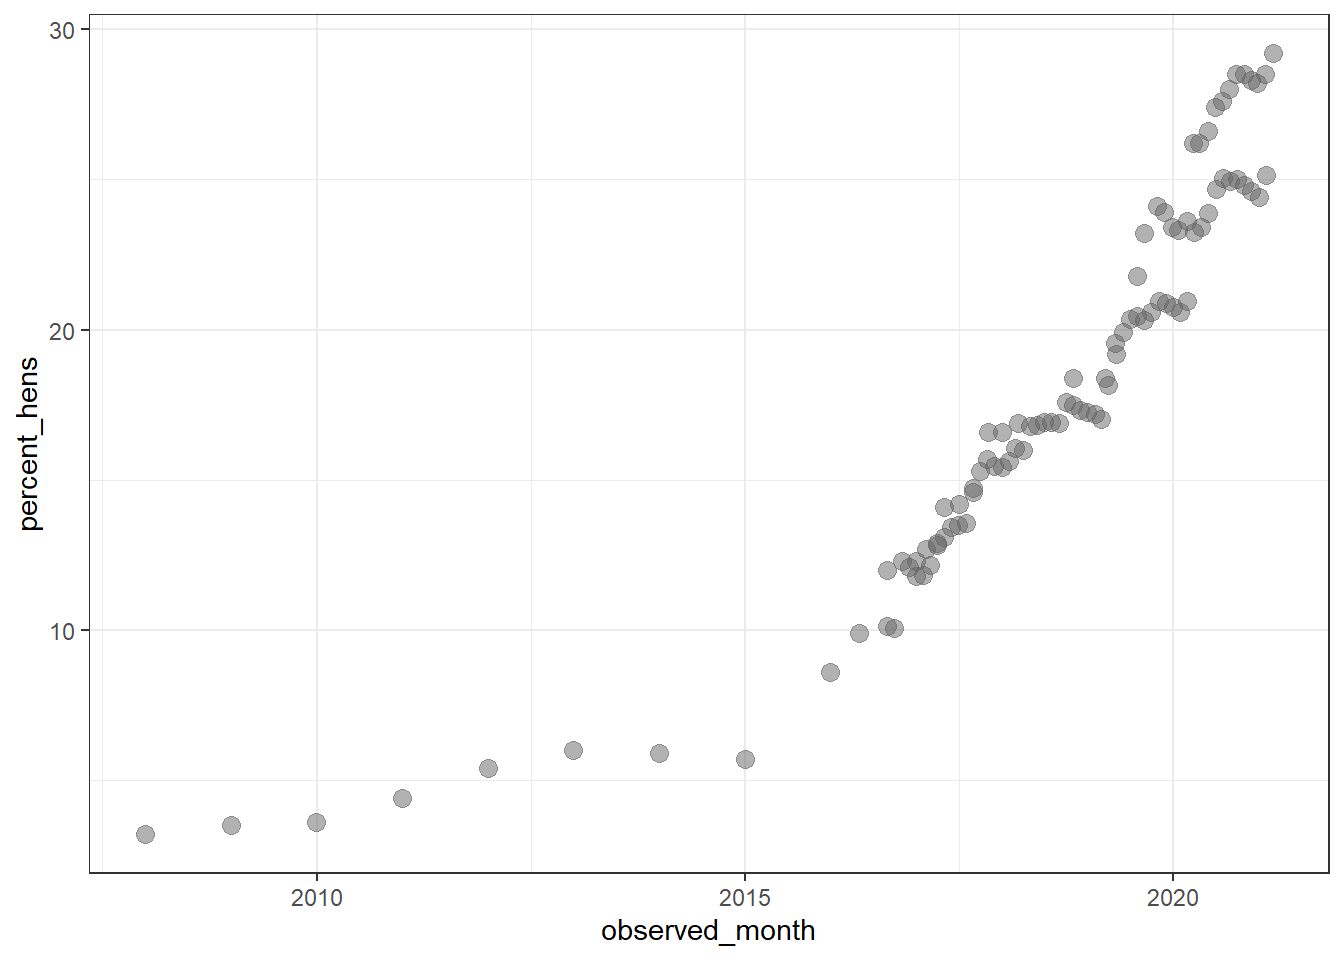
$ observed_month <date> 2007-12-31, 2008-12-31, 2009-12-31, 2010-12-31, 2011-1…
$ percent_hens <dbl> 3.20000, 3.50000, 3.60000, 4.40000, 5.40000, 6.00000, 5…
$ percent_eggs <dbl> NA, NA, NA, NA, NA, NA, NA, NA, NA, NA, 9.634938, NA, 9…
$ source <chr> "Egg-Markets-Overview-2019-10-19.pdf", "Egg-Markets-Ove…
 observed_month        percent_hens    percent_eggs       source
 Min.   :2007-12-31   Min.   : 3.20   Min.   : 9.557   Length:96
 1st Qu.:2017-05-23   1st Qu.:13.46   1st Qu.:14.521   Class :character
 Median :2018-11-15   Median :17.30   Median :16.235   Mode  :character
 Mean   :2018-05-12   Mean   :17.95   Mean   :17.095
 3rd Qu.:2020-02-28   3rd Qu.:23.46   3rd Qu.:19.460
 Max.   :2021-02-28   Max.   :29.20   Max.   :24.546
                                      NA's   :42